Water is the most fundamental resource that supports life. Many human activities no doubt depend on water such as agriculture, industrial processes, hospitals even cooling engines on cars. However, the commodity remains scarce despite the earth having approximately 71% covered with water. Approximately 97% of the earth's water is found in the oceans and often too salty for drinking, growing crops, and most industrial uses except cooling. The devastating part is that only 3% of the earth's water is fresh. This is what brings about drought, hunger, starvation and even reducing the efficiency of machinery. Knowing the water quality and mineral composition, reduces treatment costs and hence making the commodity cheaper, safe and affordable for sustainability. Water parameters such as pH, turbidity, temperature, Electrical conductivity (EC) and Total Dissolved Solids (TDS), mineral composition and color affects its purity.
In the middle of the Covid-19 pandemic people stay at home and are now using more water than before. In addition, most treatment plants don't have standard affordable equipment to automatically collect water parameters data, process and help in water treatment decisions. These decisions are often how much water treatment chemicals to apply, analysis of treated water properties, water leakages and disposal of wastewater. Therefore, we were set on a mission to deploy water quality monitoring sensors at the Nyeri Water and Sanitation Company (NYEWASCO) water treatment facility in central Kenya.
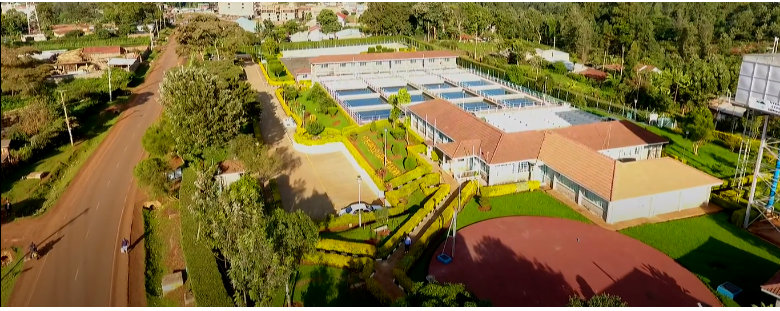
Figure 1: Aerial photo of NYEWASCO water treatment plant in Nyeri-Kenya
We selected parameters the company was interested in during the water treatment process. The parameters are; water pH, turbidity and temperature. We assembled three sensor nodes using the stm32 f446re nucleo board, lora transceiver shield, lora 8 channel multitech indoor gateway, water pH, turbidity and temperature sensors.
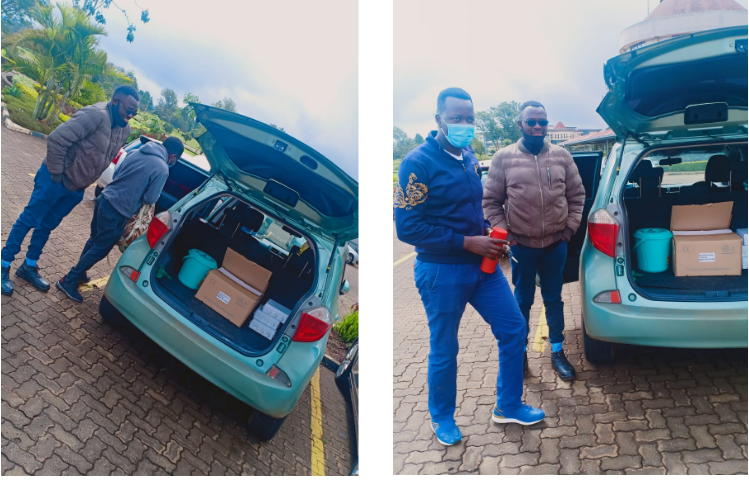
Figure 2: Preparing for field deployment
Prototyping
We spent a few hours in the lab designing, assembling hardware and programming three sensor nodes. Water pH is measured using an analog pH sensor which works like a voltmeter. It measures the voltage or electrical potential produced by water whose acidity we're interested in by comparing it with the voltage of a known solution. The difference in voltage helps deduce pH value proportionally.Turbidity sensor SKU SENO189 on the other hand measures the relative clarity of a water. It has an optical feature that shows measurement of the amount of light that is scattered by particles and other materials in the water when a light is shone through water. The higher the intensity of scattered light, the higher the turbidity. Normally in the water treatment process they add Aluminium sulphate to help settle down these particles then later filtered. Various types of hardware used are as shown in Figure 3.
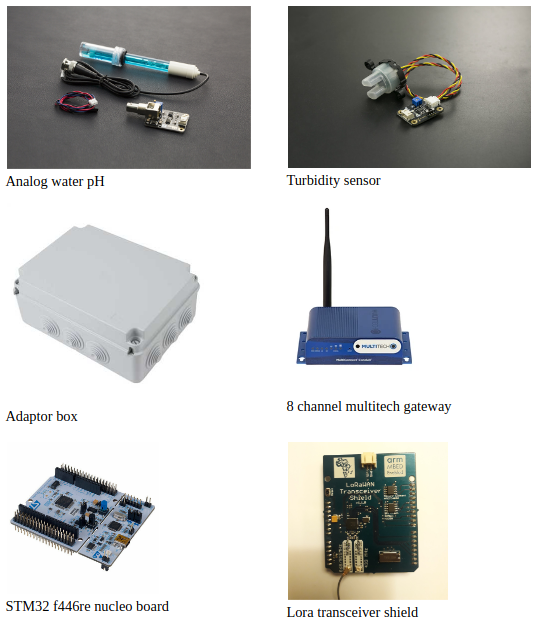
Figure 3: Hardware parts used to make the sensor nodes.
The hardware was assembled in the lab and was programmed using mbed compiler to measure the three parameters. After assembling, the prototypes were messy with wires. A decision to design a pcb circuit and etched it was arrived at to make the work neat, eliminate messy wires and minimize point of failure.
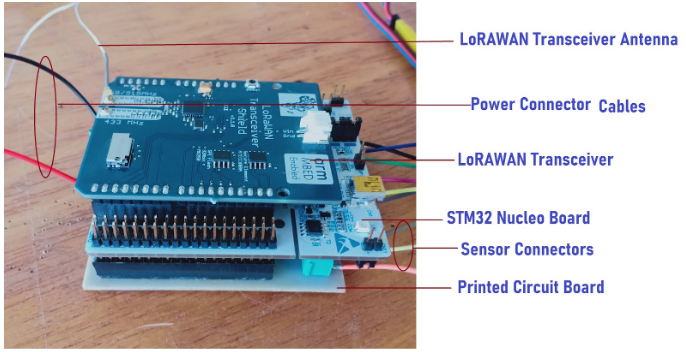
Figure 4: Assembled water quality monitoring sensor node prototype
Calibration
The sensors were not accurate and consistent as observed in sample measurements. Therefore, calibration was done in the NYEWASCO treatment plant laboratory using the standard primary instruments and solutions. Various sample data points were taken from both the node and laboratory sensors and correlation established in the software program. Accuracy improved significantly.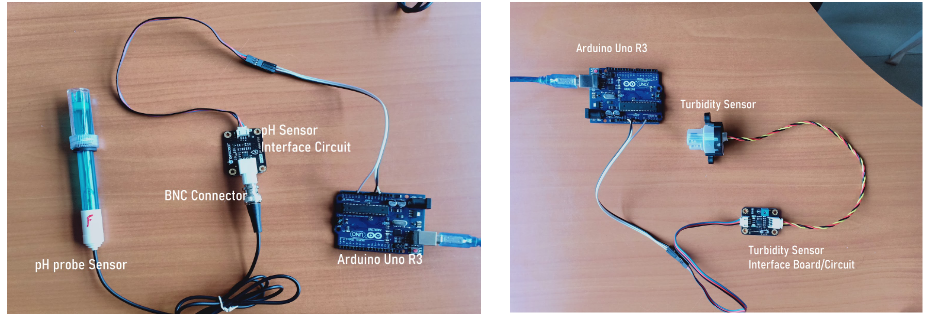
Figure 5: Calibration of water pH sensor using buffer solutions (left) and turbidity sensor
Deployment
Most of the time deployment and data collection is the most intimidating process. A reconnaissance was done in the water treatment plant on the first day to get authorization clearance, identify deployment areas and assess connectivity means for instance internet and power got the gateway. Sensor mulfunction and power management were our main challenges. Figure 6 shows how we got over them.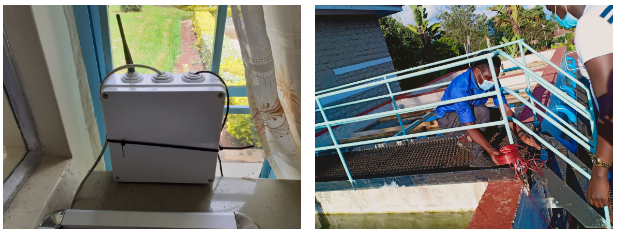
Figure 6: Installed gateway in an office (left) and power connection process
Results
Figure 7 shows a deployed sensors node to collect raw water parameters to The Things Network Server (TTN) via the 8 channel LoRa gateway connected to internet and power. Check out the results and more on this journal.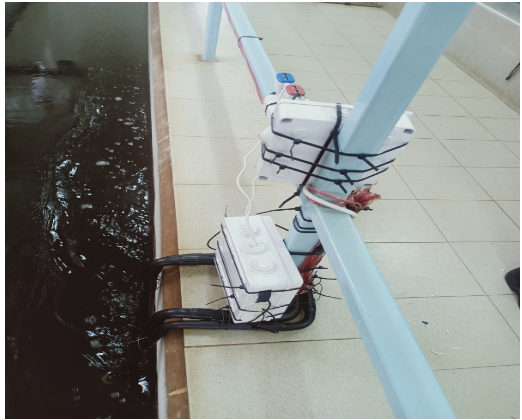
Figure 7: Deployed water quality monitoring sensor node
I wish to acknowledge Nahshon Mokua, Dr. Ciira wa Maina, Jason Kabi and NYEWASCO management for their input in this work. Credit goes to the authers of the referenced journal